
Heroku Observability Is Broken at Scale - Here's What Production Teams Use Instead
What production-grade observability actually looks like beyond Heroku


TL;DR
What this covers: Why Heroku’s observability model fails at production scale, what the real financial and operational cost of the standard Heroku monitoring stack is, what natively integrated observability looks like on a modern alternative, and how AWS maps to the full Heroku stack without requiring Kubernetes expertise.
Who it is for: CTOs and VPs of Engineering running production SaaS workloads on Heroku who are evaluating alternatives, specifically teams that want better observability without a post-migration setup project before they can operate in production.
The conclusion: Heroku’s monitoring story is not weak because Heroku chose bad add-ons. It is structurally weak because Heroku’s architecture requires you to assemble observability from disconnected third-party tools, each with its own data model, pricing tier, and alert configuration. At production scale, that model creates financial overhead, incident response friction, and operational blind spots that integrated platforms eliminate by design.
Why Heroku’s Monitoring Story Collapses at Production Scale
Heroku’s observability model made sense when most Heroku applications were single services with modest traffic. A Papertrail log drain, a basic New Relic agent, and a status page were enough to know whether the application was healthy.
The problem is not that these tools are bad. The problem is the architectural model: Heroku provides no native observability layer. Every observability capability, logs, metrics, APM, error tracking, and uptime monitoring must be sourced from independent third-party add-ons, each billing separately, each storing data in its own system, each requiring separate configuration.
At a low scale with a single service, this is manageable. At production scale with five, ten, or fifteen services, the model breaks in three specific ways.
Fragmentation makes incidents slower to resolve.
When an incident occurs, the first task is correlation: which service is affected, what changed recently, and what does the error pattern look like relative to traffic and resource usage?
On Heroku, answering these questions requires switching between tools. Logs are in Papertrail. Application metrics and traces are in New Relic or Scout. Infrastructure metrics, if they exist at all, are in a separate monitoring add-on. Each tool has its own data model, its own time axis, and its own filtering interface.
The act of correlating a spike in error rates with a recent deployment, a specific service, and an underlying resource constraint requires context-switching between three or four separate interfaces. Every switch adds friction. Under incident pressure at 2 AM, that friction adds minutes to the mean time to resolution. For SaaS applications with customer-facing SLAs, those minutes are the difference between an incident that resolves cleanly and one that triggers a customer escalation.
Add-on cost compounds with service count, not with revenue.
This is the financial dynamic that surprises engineering leaders when they examine the Heroku invoice carefully. Observability costs on Heroku do not scale with your revenue. They scale with your service count and your log volume, both of which grow with product complexity, not with business growth.
Every new service adds a New Relic agent at the APM tier pricing. Every new service adds log volume that pushes Papertrail closer to the next pricing tier. Every additional engineer writing more verbose log output accelerates the compounding. The observability bill grows faster than the application bill, and faster than revenue, at precisely the growth stage where unit economics start mattering to the board.
Coverage gaps appear exactly when you need visibility most.
Heroku’s add-on model creates a specific failure mode: teams instrument the things they thought to instrument and are blind to everything else. The standard Heroku observability stack provides application-level logs and request-level APM traces. It does not provide container-level resource utilisation, memory pressure per service, pod restart counts, or infrastructure-level metrics that distinguish “application bug” from “resource constraint” during an incident.
Teams discover these coverage gaps at the worst possible time: during an incident that turns out to be a memory leak or a resource exhaustion pattern that no application-level log or APM trace would ever surface. The gap between what the monitoring shows and what is actually happening is the gap that turns a 15-minute incident into a two-hour war room.
Want to see what integrated observability looks like on LocalOps? Schedule a walkthrough →
The Real Cost of the Standard Heroku Observability Stack
The standard production observability stack on Heroku is assembled from three to five tools. Each carries its own cost. The combined cost compounds with service count in ways that most teams do not fully account for until they audit the invoice line by line.
The standard stack and what it actually costs:
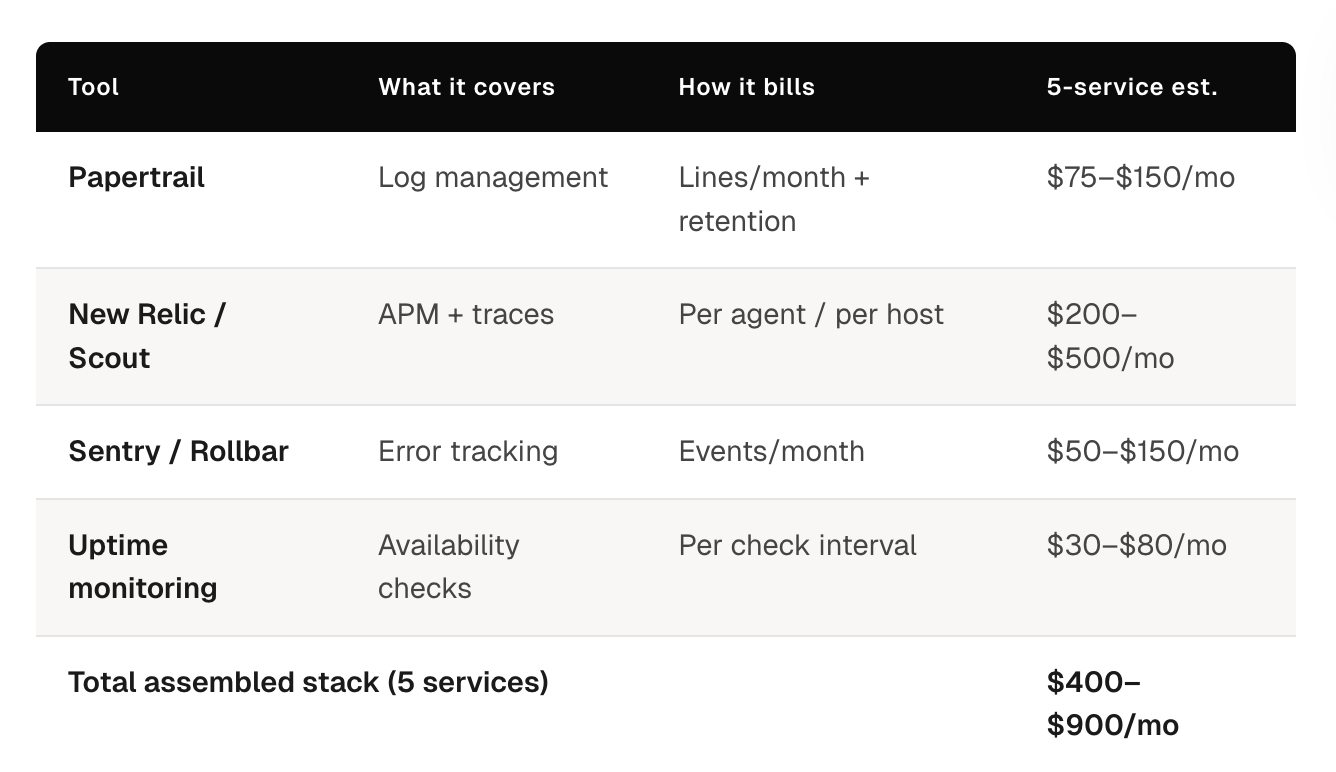
Papertrail (Log Management)
Papertrail pricing is structured around log volume: lines per month, retention period, and search capability. At low log volume with a single service, the cost is manageable. The problem is that log volume does not scale linearly with traffic. It scales with service count; more services mean more internal log output independent of external request volume, and with engineering team size, since more engineers writing more instrumentation produces higher baseline log output.
A team running five production services with reasonable log verbosity typically sits in a Papertrail tier that costs meaningfully more per month than the entry-level plan. Each additional service adds log volume that may or may not trigger a tier jump, but always moves the team closer to one.
New Relic or Scout APM (Application Performance Monitoring)
APM pricing on Heroku add-ons scales with host count or agent count. Adding a new service adds a new APM agent. Adding a new dyno for horizontal scaling adds another agent at the same per-agent rate.
For teams that run multiple services with multiple dynos each, the APM bill can easily exceed the compute bill. This is the observability cost that most surprises engineering leaders during a cost audit: the monitoring costs more than the compute it monitors.
Additional Tools: Error Tracking, Uptime Monitoring, Alerting
A production-ready observability setup also typically includes Sentry or Rollbar for error tracking, an uptime monitoring tool, and a separate alerting layer since Heroku’s native alerting capabilities are limited.
Each tool adds a billing line item. Each tool adds a configuration surface that someone on the team needs to maintain. Each tool is a separate place to look during an incident.
The combined financial picture:
For a typical five-service production stack on Heroku, the assembled observability stack costs between $400 and $900 per month, depending on traffic volume, service count, and the specific tools chosen. This number is not fixed; it grows with every new service, every traffic spike that pushes log volume past a tier boundary, and every new engineer that joins and starts writing logs.
The observability line item on a Heroku invoice is frequently larger than teams expect when they first examine it carefully, and it is one of the fastest-growing line items as the product scales.
The operational cost beyond the financial one:
The financial cost is real and calculable. The operational cost is often larger and harder to quantify.
The operational cost of a fragmented observability stack shows up in three places:
Initial configuration time. Setting up Papertrail drain correctly, instrumenting New Relic across services, configuring alert thresholds, and wiring everything together is a non-trivial engineering project. Teams typically underestimate this when they first assemble the stack and then absorb the cost invisibly over time as new services require the same configuration cycle.
Maintenance overhead. Each tool has its own configuration format, its own agent version requirements, and its own deprecation cycles. When New Relic releases a breaking change to their agent API, someone has to update every service. When Papertrail changes its drain configuration format, someone has to update the drain setup for every application. Multiply this by the number of tools in the stack.
Incident response friction. As described above, the cost of context-switching between three or four separate monitoring interfaces during an incident is paid in minutes of additional incident duration on every incident. For a team running ten incidents per month at an average of fifteen minutes of additional context-switching overhead per incident, that is 2.5 hours of senior engineering time per month spent on avoidable tool friction during the highest-stress moments of the operational cycle.
What Natively Integrated Observability Looks Like on a Modern Heroku Alternative
The architectural difference between Heroku’s assembled monitoring model and natively integrated observability is not a difference of tools. Prometheus, Loki, and Grafana are open-source projects that exist outside of any platform. The difference is where the assembly and configuration happen: in the platform layer versus in every customer’s environment.
On a modern Heroku alternative with integrated observability, the monitoring stack is part of the platform. It is not a list of recommended tools teams should configure after migration. It is infrastructure that exists and runs from day one, covering every service deployed to the platform without additional setup.
See how LocalOps handles observability out of the box →
What this looks like in practice with LocalOps:
LocalOps provisions Prometheus, Loki, and Grafana automatically as part of every environment, development, staging, and production. There is no observability setup step after migration. There is no drain configuration, no agent installation, and no dashboard provisioning. The stack is ready when the environment is ready.
Prometheus: Metrics Without Agent Installation
Prometheus collects metrics automatically from every service deployed to the platform: CPU utilisation, memory consumption, request rate, error rate, response latency, and any custom application metrics exposed on a standard metrics endpoint.
The difference between New Relic and Scout on Heroku is structural. New Relic requires agent installation and configuration per service. Prometheus on Kubernetes scrapes metrics from services automatically using service discovery, no agent, no per-service configuration, no per-service billing.
Teams get infrastructure-level and application-level metrics in the same system with the same data model. A memory pressure problem that triggers a pod restart and causes elevated error rates is visible as a single correlated event in Prometheus, not as two separate signals in two separate monitoring tools.
Loki: Log Aggregation Without Drain Configuration
Loki aggregates logs from all services through standard output. Services write logs to stdout. Loki collects them automatically. There is no Papertrail drain to configure, no log format requirement, and no volume-based pricing tier to worry about.
The operational difference from Papertrail is meaningful. Papertrail requires configuring a log drain URL per application, managing drain credentials, and monitoring log volume to avoid unexpected tier jumps. Loki on Kubernetes collects logs from every container automatically through standard Kubernetes log aggregation. New services are covered the moment they deploy.
Grafana: Unified Dashboards for Logs and Metrics
Grafana provides dashboards that query both Prometheus and Loki simultaneously. When an incident occurs, the engineer opens a single interface, selects the relevant service, and sees metrics and logs side by side with the same timestamps.
The incident response workflow changes fundamentally. Instead of opening Papertrail, filtering to the relevant service, opening New Relic, correlating the timeline, and switching back and forth, the workflow is: open Grafana, select the service and timeframe, and see the full picture.
LocalOps includes pre-built dashboards for infrastructure health, service-level metrics, and deployment events. Teams get operational visibility from day one without building dashboards from scratch as a separate project.
What AWS Looks Like as a Heroku Alternative, Without Requiring Kubernetes Expertise
The most common objection to AWS-based Heroku alternatives is not cost or capability; it is operational complexity. AWS is powerful but not self-serve for developers. A developer who can deploy a Heroku app in five minutes cannot deploy the same app to EKS in five minutes without a platform layer that abstracts the Kubernetes and AWS operations.
This objection is valid when applied to raw AWS. It does not apply to AWS accessed through an Internal Developer Platform like LocalOps, where the platform layer handles the Kubernetes and AWS operations automatically.
The developer experience comparison:
On Heroku today: Developer pushes to the main branch. Heroku detects the push, runs the buildpack, creates a slug, and deploys the dyno. The developer can view logs from the Heroku dashboard. Service is running.
On LocalOps (AWS + IDP): Developer pushes to main branch. LocalOps detects the push, builds a Docker image, pushes to ECR, and deploys to EKS. The developer can view logs and metrics from the LocalOps dashboard. Service is running.
The developer experience is structurally identical. The infrastructure underneath is in the team’s AWS account, with all the compliance and control implications that it carries. But the developer never writes a Dockerfile, never touches kubectl, and never configures a Kubernetes deployment manifest unless they choose to.
Teams where developers need to understand Kubernetes to deploy services have not implemented a Heroku alternative with a platform layer. They have implemented Kubernetes and asked their product engineers to become platform engineers. That is a different and significantly more expensive outcome.
How AWS Services Map to the Full Heroku Stack
For engineering leaders evaluating the migration, the question is not whether AWS can replace Heroku technically; it clearly can, but how each component of the Heroku stack maps to its AWS equivalent, and what the operational complexity difference looks like in practice.
The full stack mapping:
Heroku Dynos → Amazon EKS (Kubernetes on AWS)
Heroku dynos are the compute layer: containerised processes that run application code, receive traffic, and scale based on configuration.
Amazon EKS is the AWS-native equivalent: managed Kubernetes that runs containerised workloads, handles load balancing, and autoscales based on real resource metrics rather than manual dyno count adjustments.
The operational complexity difference on raw AWS is significant; Kubernetes requires configuration that Heroku handles automatically. Through LocalOps, the EKS cluster is provisioned, configured, and managed as part of the platform. Developers deploy to it without writing Kubernetes YAML.
The capability difference favours EKS meaningfully at scale:
Horizontal autoscaling responds dynamically to CPU and memory pressure rather than requiring manual dyno count changes
Workloads scale to zero during off-peak periods rather than running at minimum dyno count continuously
Pod resource limits can be set per service rather than per dyno tier
Deployment strategies (rolling, blue-green) are configurable rather than fixed
Heroku Postgres → Amazon RDS
Heroku Postgres is a managed PostgreSQL service with pricing structured around row limits, connection limits, and storage tiers that force upgrades as databases grow.
Amazon RDS is the AWS-native managed PostgreSQL equivalent. The structural pricing difference is significant: RDS charges based on instance type and actual storage consumed, not on arbitrary row count and connection limit tiers. A database at 7 million rows costs the same instance rate as a database at 5 million rows, as long as the instance type handles both workloads. There are no forced tier jumps driven by row counts.
Operational capabilities on RDS exceed Heroku Postgres at production scale: automated backups with configurable retention, read replica support for read-heavy workloads, Multi-AZ deployment for high availability, and storage autoscaling that expands capacity automatically without manual intervention.
Heroku Redis → Amazon ElastiCache
Heroku Redis pricing scales with connection count. As more services connect to Redis, the connection count drives tier upgrades that are significant price jumps relative to the actual resource consumption increase.
Amazon ElastiCache prices are based on node type and replication configuration. Connection count does not drive pricing. A five-service application with 200 total Redis connections costs the same ElastiCache rate as a two-service application with 50 connections, if the node type handles both workloads.
For multi-service architectures, this pricing difference is substantial. Every service in a Heroku stack that uses Redis adds to the connection count. ElastiCache pricing is indifferent to connection count within node capacity limits.
Heroku Monitoring Stack → Prometheus + Loki + Grafana (included in LocalOps)
As covered in detail above, the assembled Heroku monitoring stack of Papertrail, New Relic or Scout, and additional tools is replaced on LocalOps by an integrated observability stack that is part of the platform at no additional cost.
The financial comparison: $400–$900/month for the assembled Heroku observability stack versus zero additional cost on LocalOps, where Prometheus, Loki, and Grafana are included in the platform.
The operational comparison: multiple tools with separate configuration, separate data models, and separate alert configurations versus a unified stack with integrated dashboards, automatic service discovery, and correlated metrics and logs in a single interface.
Heroku Scheduler → Amazon ECS Scheduled Tasks or Kubernetes CronJobs
Heroku Scheduler handles time-based job execution with limited configurability: jobs run at defined intervals, there is minimal execution history, and there is no native retry logic or failure alerting beyond basic log output.
On AWS via LocalOps, scheduled jobs run as Kubernetes CronJobs: execution history is retained and queryable, failure alerting integrates with the platform’s observability stack, retry logic is configurable per job, and job resource allocation is separate from web dyno configuration, so scheduled jobs do not compete with request-serving workloads for resources.
Heroku Add-Ons (Miscellaneous) → AWS-Native Services
The broader Heroku add-on ecosystem, search, queuing, email, feature flags, and maps to AWS-native services or best-in-class managed services that run independently of the deployment platform. The key operational difference is that these integrations are not intermediated by Heroku’s add-on marketplace pricing layer. Teams connect directly to AWS SQS, OpenSearch, SES, or their preferred SaaS tools at the provider’s pricing without a platform markup.
How LocalOps Delivers This in Practice
LocalOps is an AWS-native Internal Developer Platform built specifically for teams replacing Heroku. It handles the EKS cluster, VPC, load balancers, IAM roles, and observability stack automatically, and delivers the developer experience that makes Heroku compelling, running on infrastructure the business controls.
The setup path:
Connect your AWS account. Connect your GitHub repository. LocalOps provisions a dedicated VPC, EKS cluster, load balancers, IAM roles, and the full observability stack, Prometheus, Loki, and Grafana, automatically. No Terraform. No Helm charts. No manual configuration. First environment ready in under 30 minutes.
From that point, the developer workflow is identical to Heroku. Push to your configured branch. LocalOps builds, containerises, and deploys to AWS automatically. Logs and metrics are available in Grafana from day one. Autoscaling and auto-healing run by default. Secrets management runs through AWS Secrets Manager with audit logging.
The observability stack that costs $400–$900/month in Heroku add-ons is included in LocalOps as infrastructure. There is no add-on to configure. There is no additional cost. There is no vendor to manage.
The infrastructure runs in your AWS account. If you stop using LocalOps, it keeps running.
“Their thoughtfully designed product and tooling entirely eliminated the typical implementation headaches. Partnering with LocalOps has been one of our best technical decisions.” – Prashanth YV, Ex-Razorpay, CTO and Co-founder, Zivy
“Even if we had diverted all our engineering resources to doing this in-house, it would have easily taken 10–12 man months of effort, all of which LocalOps has saved for us.” – Gaurav Verma, CTO and Co-founder, SuprSend
Get started for free — first environment live in under 30 minutes →
Frequently Asked Questions
Why does Heroku’s monitoring break at production scale specifically, rather than at early stages?
At early stages, with one or two services, modest traffic, and a small engineering team, the assembled Heroku monitoring stack is manageable. The financial cost is limited, the configuration overhead is a one-time investment, and incident correlation across two tools is not prohibitively slow. The model breaks at the production scale because each of its weaknesses compounds with the service count. Financial cost multiplies per service. Configuration overhead recurs with every new service. Incident correlation becomes slower as the number of services generating signals increases and the number of tools required to correlate them grows. The same architectural model that works at low scale becomes operationally and financially indefensible when the number of services in production grows past five to ten.
Can teams get Prometheus, Grafana, and Loki without using an IDP like LocalOps?
Yes, all three are open-source projects and can be self-hosted. The operational cost of doing so is the relevant variable. Setting up Prometheus correctly on Kubernetes with appropriate scrape configurations, retention policies, and alert rules is a non-trivial engineering project. Integrating Loki with a log aggregation pipeline that covers all services requires additional configuration. Building Grafana dashboards from scratch that surface the metrics and logs relevant to production operations requires additional time. The open-source tools are available; the pre-configured, production-ready integration is what LocalOps provides as part of the platform. Teams that want to do this work themselves can. Teams that want to be in production on day one without an observability setup project use LocalOps.
What does the migration path from Heroku Postgres to Amazon RDS look like?
The core migration has three steps: provisioning an RDS instance with the same engine version, migrating data using pg_dump and pg_restore or AWS Database Migration Service, and updating application connection strings. The most important operational consideration is connection pooling: Heroku Postgres bundles PgBouncer connection pooling in its managed tiers. On RDS, connection pooling is configured separately using RDS Proxy or a self-managed PgBouncer instance. LocalOps handles the RDS provisioning and configuration automatically. The data migration guide in LocalOps’s documentation covers the full process with step-by-step instructions for typical Heroku Postgres configurations.
Read the full migration guide →
How does the observability model change for teams running Rails applications on Heroku?
Rails applications on Heroku are typically instrumented with the New Relic Ruby agent for request tracing and rely on Heroku’s log output with Papertrail for log management. On LocalOps, Rails applications are instrumented with the OpenTelemetry Ruby SDK or use Prometheus’s Ruby client for custom metrics. Logs are written to stdout and are collected automatically by Loki. The instrumentation model is more explicit than New Relic’s automatic instrumentation, but it is also more flexible and not tied to a proprietary agent. Teams migrating Rails applications from Heroku typically find that the instrumentation migration takes one to two days. The observability visibility post-migration is meaningfully better than Heroku + New Relic + Papertrail because logs and metrics are correlated in a single interface.
What is the realistic total cost of ownership comparison between Heroku observability and LocalOps for a five-service production stack?
For a five-service production stack on Heroku, the observability component alone typically runs $400–$900/month: Papertrail at a tier appropriate for multi-service log volume, New Relic or Scout at per-agent pricing across five services and their dynos, plus error tracking and uptime monitoring tools. On LocalOps, the observability stack, Prometheus, Loki, and Grafana, is included at zero additional cost. The total infrastructure cost for the same five-service stack runs at AWS list pricing (typically $200–$400/month for compute and managed services) plus the LocalOps platform fee, replacing both the Heroku compute bill and the observability add-on bill. The observability saving alone typically exceeds the LocalOps platform fee.
Does using LocalOps create vendor lock-in that is worse than Heroku?
The opposite. Heroku’s lock-in is architectural: your infrastructure runs in Heroku’s cloud, your databases are Heroku Postgres instances, and your monitoring is Heroku-intermediated add-ons. If you stop using Heroku, everything must be rebuilt on a different platform. LocalOps provisions infrastructure in your AWS account. If you stop using LocalOps, the EKS cluster, VPC, RDS instances, ElastiCache clusters, and Prometheus stack all continue running in your AWS account. The dependency is on the platform’s operational interface, not on the platform’s infrastructure. Your Heroku dependency includes the infrastructure. Your LocalOps dependency does not.
Key Takeaways
Heroku’s observability model is broken at production scale, not because of any single tool’s weakness, but because the architectural model, assembling monitoring from disconnected third-party add-ons, creates compounding financial cost, operational fragmentation, and coverage gaps that grow with every service added to the production stack.
The $400–$900/month observability bill for a five-service Heroku production stack is the visible portion. The invisible portion is the engineering time spent on configuration, maintenance, and incident response friction across disconnected tools, costs that compound silently and rarely surface in infrastructure reviews.
Natively integrated observability on a modern Heroku alternative resolves this at the architectural level. When Prometheus, Loki, and Grafana are part of the platform rather than add-ons assembled after the fact, the financial cost disappears, the configuration overhead disappears, and the incident response workflow improves from three tools to one.
The AWS-to-Heroku stack mapping is complete: EKS replaces dynos with autoscaling that matches real workload patterns, RDS replaces Heroku Postgres without tier-jump pricing, ElastiCache replaces Heroku Redis without connection-count pricing penalties, and the LocalOps observability stack replaces the assembled Heroku monitoring stack at zero additional cost.
What platform teams gain: infrastructure in their AWS account, compliance posture for enterprise customers, and observability that is better than anything the Heroku add-on stack provides.
What developers keep: a deployment experience that is identical to Heroku, push to branch, service deploys, logs and metrics are immediately available.
Get Started with LocalOps → First production environment on AWS in under 30 minutes. No credit card required.
Schedule a Migration Call → Our engineers model your current Heroku observability costs against LocalOps + AWS and walk through the migration for your specific stack.
Read the Heroku Migration Guide → Full technical walkthrough: database migration, environment setup, DNS cutover.
Related reading: